Results 1 to 6 of 6

Thread: Fishing Data. Kg's per Sq Kilometer. World Stats. 2009

  1. #1

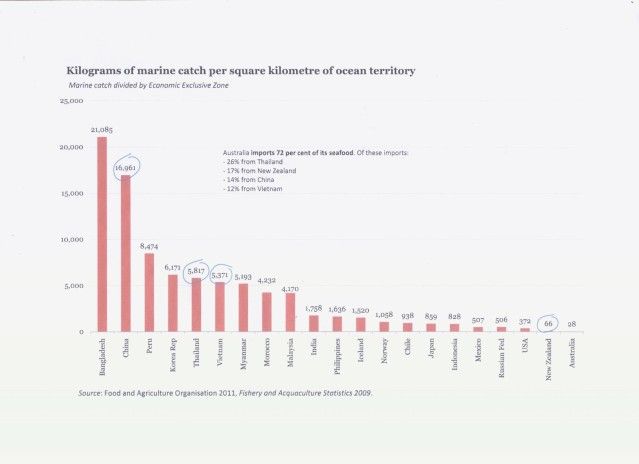
    Fishing Data. Kg's per Sq Kilometer. World Stats. 2009

    For those that want the facts, here is the Official stats on World Economic Region Marine ( Ocean caught ) catch.

    Please note... Australia has the LOWEST catch rate in the world and this is due to our zonings ( MPA's ) , management, policing, health of environment, pro and rec fishing education / practices and sustancial area under our control. My reason for posting this is to show that we do NOT need anymore zonings, closures etc. What we need, is to STOP importing substandard crap products from OS and not allow OS longliners and supertrawllers into our waters.

    Our fishery is the envy of the rest of the world and that world will try anything to get their hands on our fish stocks.

    PLEASE ALSO NOTE..... Australia IMPORTS 72% of it's seafoods.


    Cheers LP
    Last edited by Lucky_Phill; 25-06-2012 at 03:42 PM.
    Kingfisher Painting Solutions:- Domestic and Commercial.

    For further information, contact details, quotes or advice - Click Here


  2. #2

    Re: Fishing Data. Kg's per Sq Kilometer. World Stats. 2009

    Phill just a question with these figures. Would these figures in say china be higher due to whaling as it is a kg per sq kilometer and not quantity of fish. Not that i condone either the super trawler or the whaling, and parts of the world have stuffed there seas so obviously what they have done doesnt work, don't bring it to Australia.
    Just an observation on the figures.

  3. #3

    Re: Fishing Data. Kg's per Sq Kilometer. World Stats. 2009

    The figures represent all marine ( ocean caught ) catch. Yes, Whales , Dolphins etc would be included. Places like Bangladesh have a smaller coast line / territorial waters, hence a much higher rate in sqkilometer/ kg . Bangladesh imports such a small amount of seafood from OS, that it will not rate on the GDP / import export scale.

    We could get bogged down in more details like sqkilometers of actual ocean per Economic Zone, population data, coastline data, pro-fishing fleet catch vs rec fishing and more, but the simple facts are, as an Economic Zone ( territorial waters ) Australia removes SFA of it's marine species for human consumption ( which includes pet food, BTW ).

    The Federal Govt do not need to legislate for more closures, they simply need to dis-allow OS pro fishing activities in our waters and place large tarrifs on imported seafoods as well as beefing up the Quality Assurance legislation. Remember the disaster when the Live cattle export issues hit the media mainstream ? well, if Australia was shown how the vast majority of OS seafoods were produced, I guarantee 2 things would happen.........

    1.... we would stop eating this crap

    and 2.... the environmentalists would be all over it, like a fat kid over a donut.

    Why is it Australias issue, when another country wants to process our " stock " in their way, but we ( Govt ) do SWA about how those countries produce their stock ????

    LP
    Last edited by Lucky_Phill; 25-06-2012 at 04:13 PM. Reason: spelling... as usual
    Kingfisher Painting Solutions:- Domestic and Commercial.

    For further information, contact details, quotes or advice - Click Here


  4. #4

    Re: Fishing Data. Kg's per Sq Kilometer. World Stats. 2009

    what some will be eating when they import more when they close our fishing down

  5. #5

    Re: Fishing Data. Kg's per Sq Kilometer. World Stats. 2009

    I reckon some people would be able to use those figures as a reason to lock up more fisheries and to install more regulations upon the those who go and fish.
    They'd say that Australia's fisheries are the worse in the world with figures like those.
    They have to be the worst fisheries in the world because nobody can catch a fish apparently/obviously.
    Those people would blame bad fisheries, environmental mismanagement and over fishing as a reason for the low figures when the real reason is people just are not allowed to go and have a fish here.....fullstop.
    I intend on living for-ever....so far so good


  6. #6

    Re: Fishing Data. Kg's per Sq Kilometer. World Stats. 2009

    Yep, I know Scotty ole' chap.

    But as I said, this data-set is only a Economic Zoning one, and other info is available to shown the bio-mass / catch rate and other specifics.

    To sum it up, Australia and its territorial waters hold the most adundant amount of " fish " out of all the worlds other " territorial waters " and we commercially and recreationally harvest the least amount of those fish. Why ? population, access and restrictive practices ( zonings etc ) and the vastness.

    On the other hand, it defiies belief that we import 72% of our seafood for consumption

    Or are you saying we are hopeless fishos

    cheers. big ears


    LP
    Kingfisher Painting Solutions:- Domestic and Commercial.

    For further information, contact details, quotes or advice - Click Here


Posting Permissions

  • You may not post new threads
  • You may not post replies
  • You may not post attachments
  • You may not edit your posts
  •  
Join us